>
$ cd /home/
About
|
Gallery
Posts
Stack
Other
|
Series
Gallery
2026
Clinic VAF Combined Plot
Combined clinic-VAF figure with detection boxplots over cumulative-read trajectories.
Mar 9
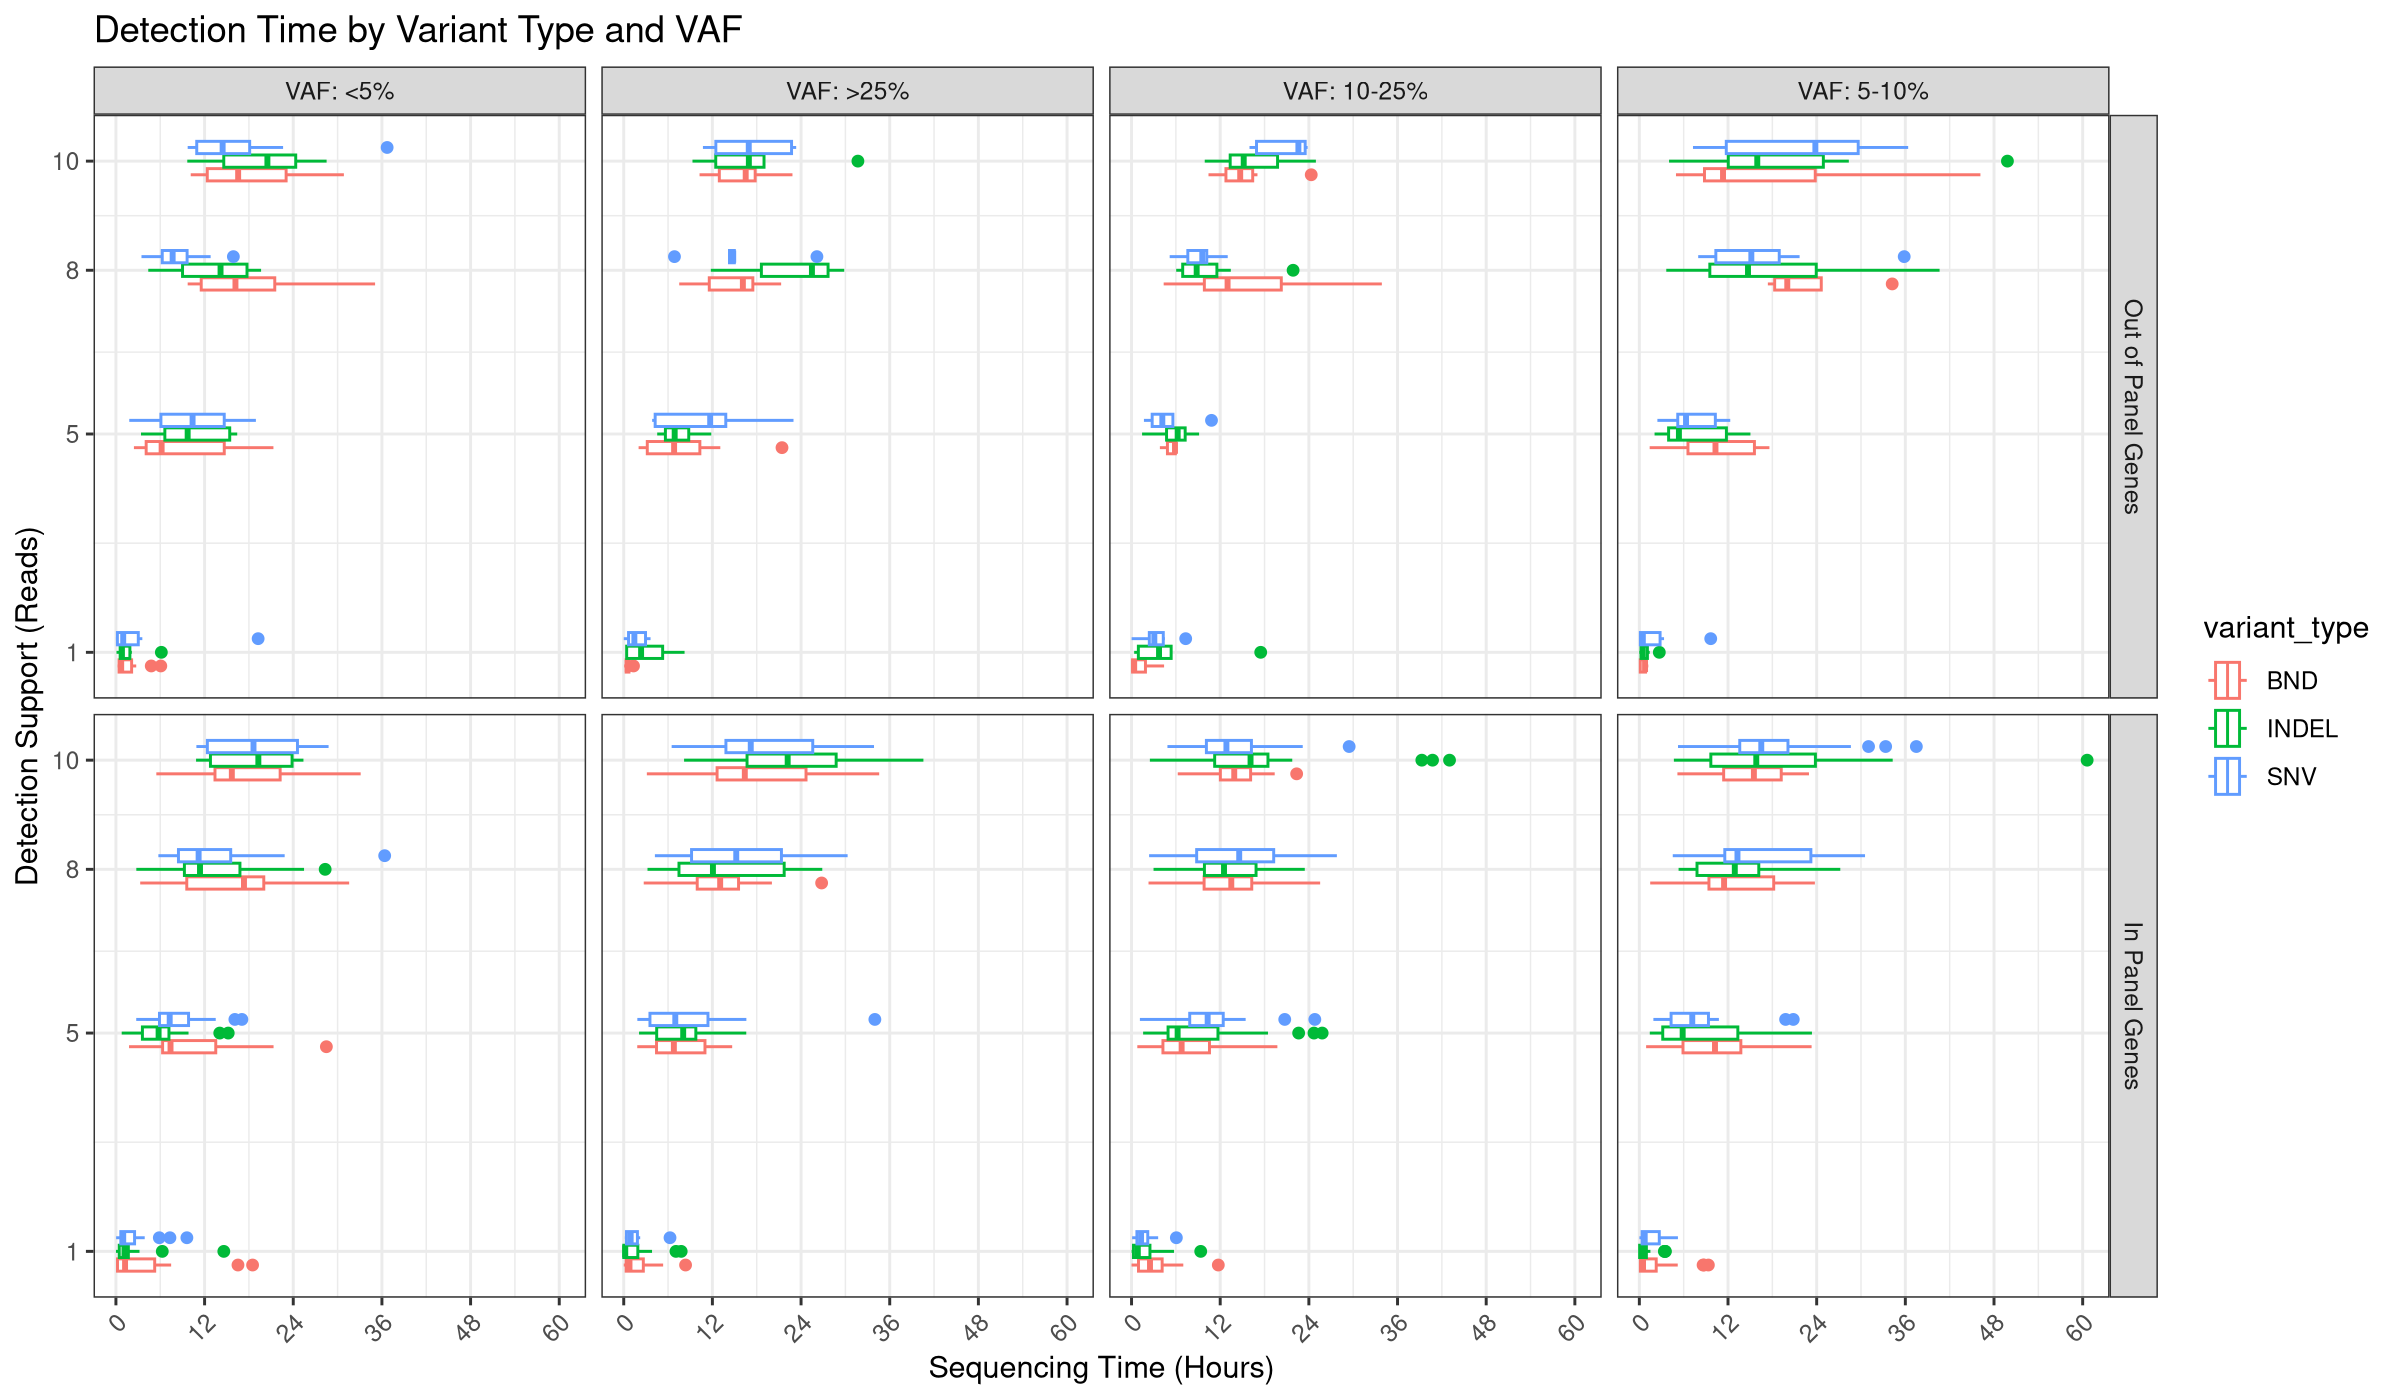
Detection Threshold Boxplot
Detection-time boxplots by read threshold, variant type, and VAF bin.
Mar 8
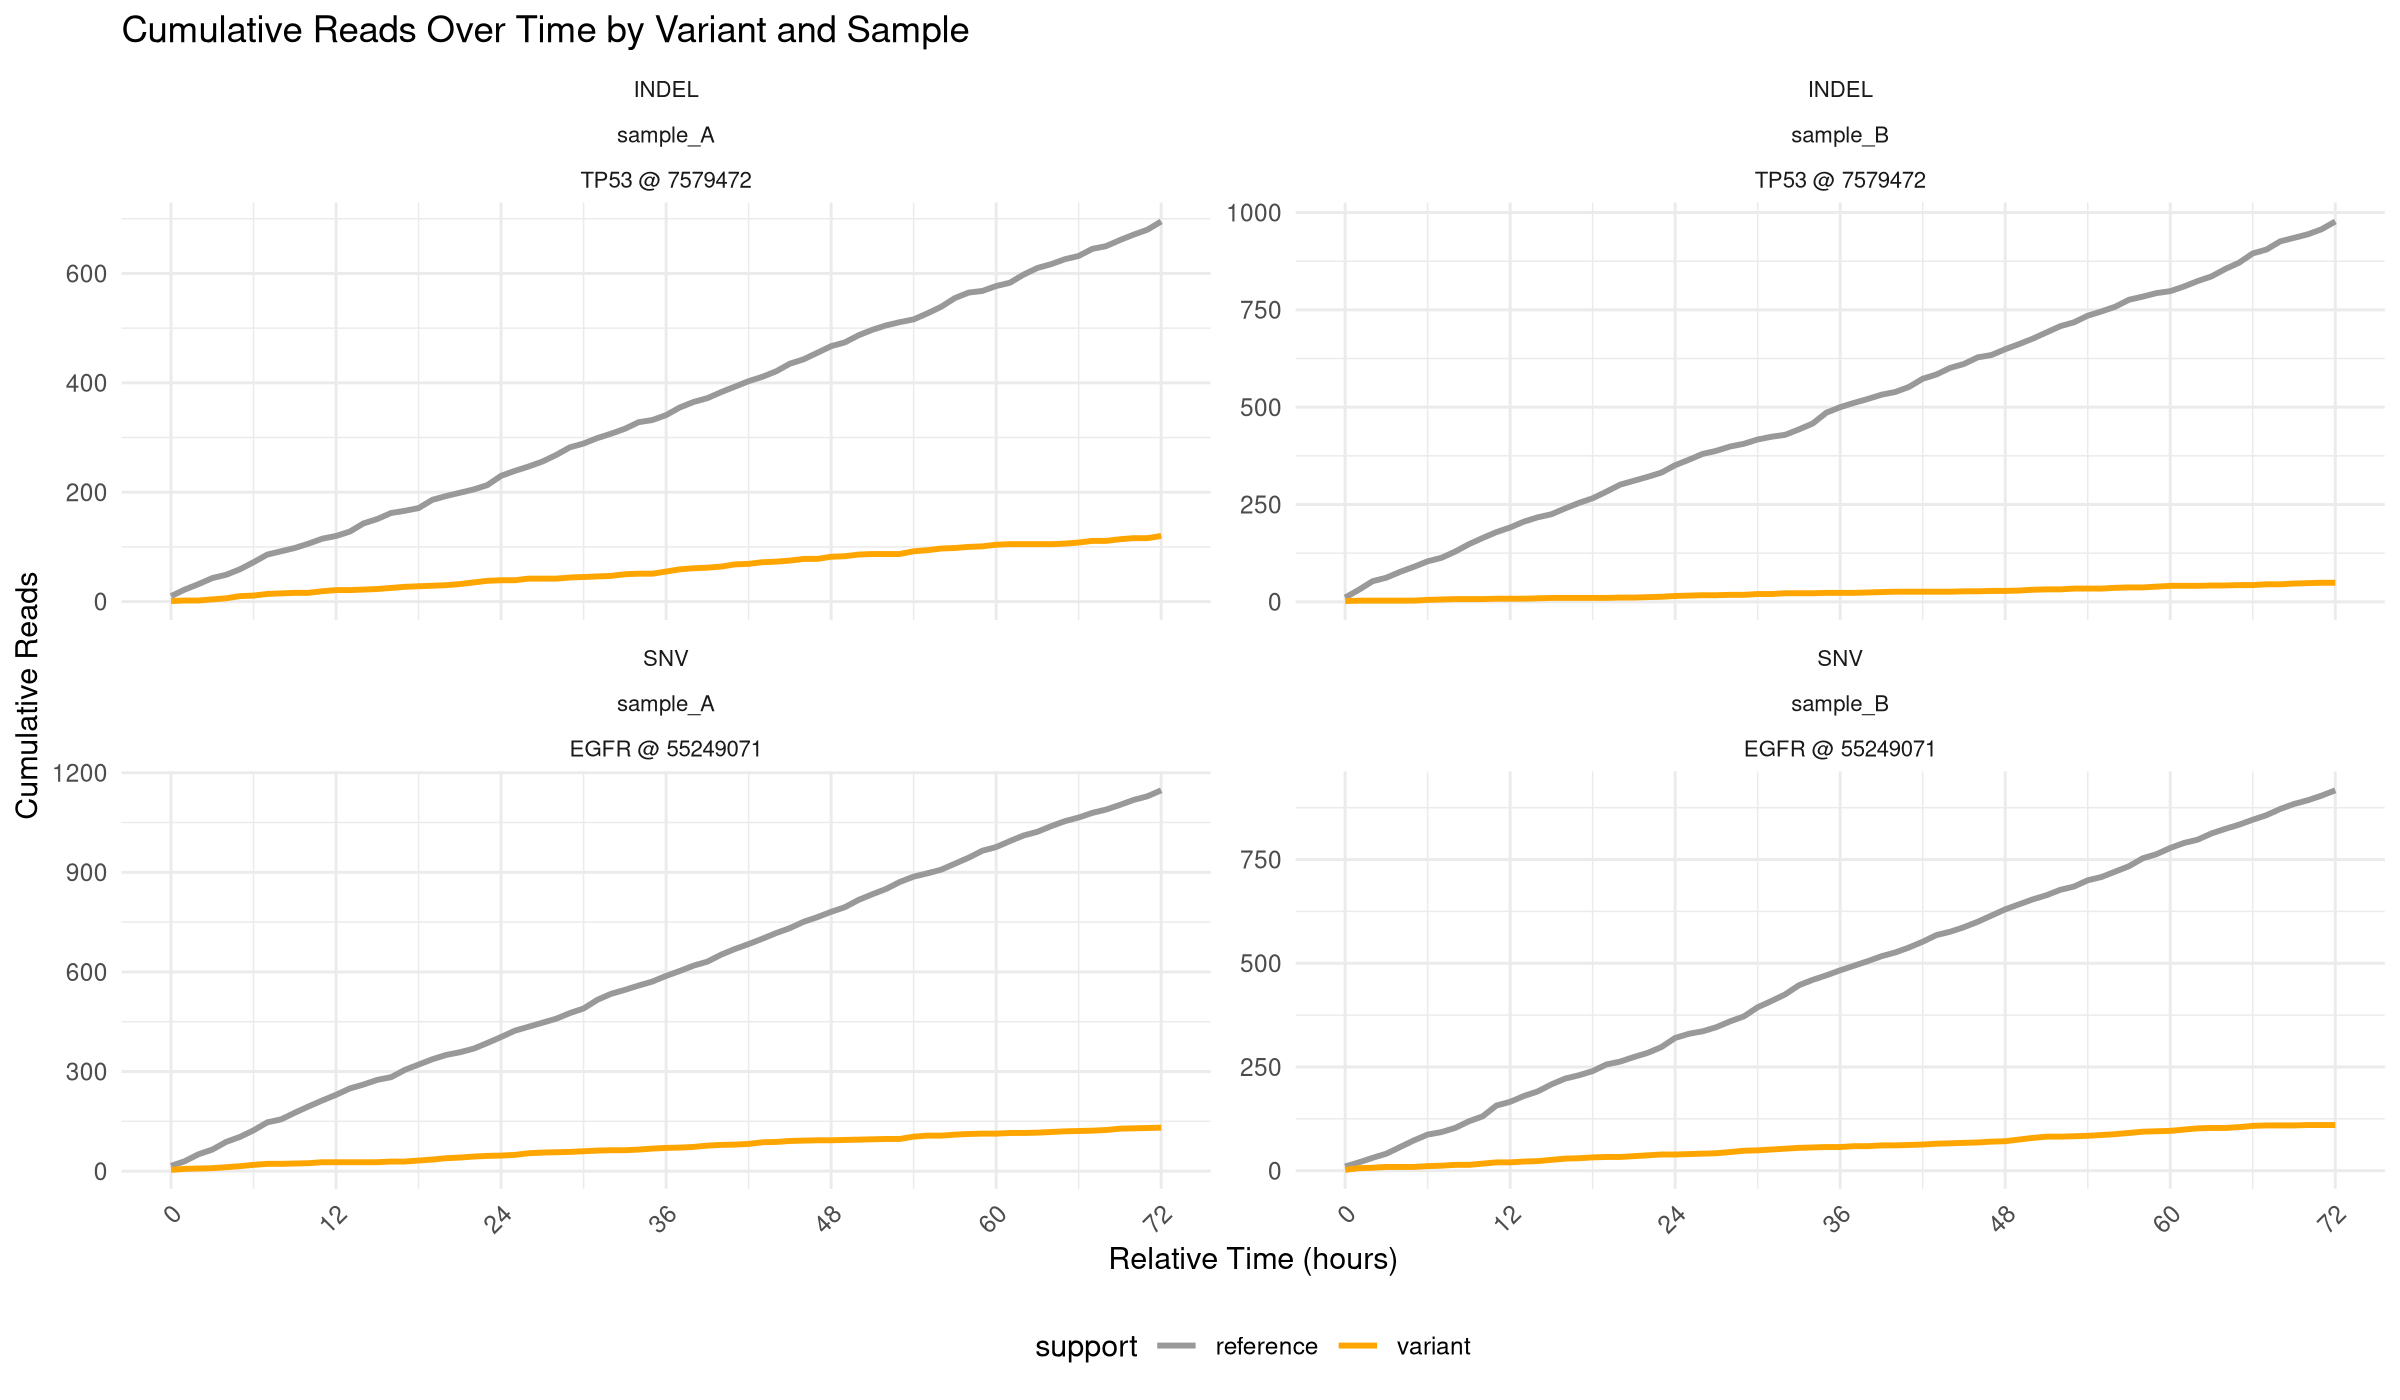
Cumulative Reads Over Time
Standalone cumulative variant/reference read trajectories over 72 hours.
Mar 7
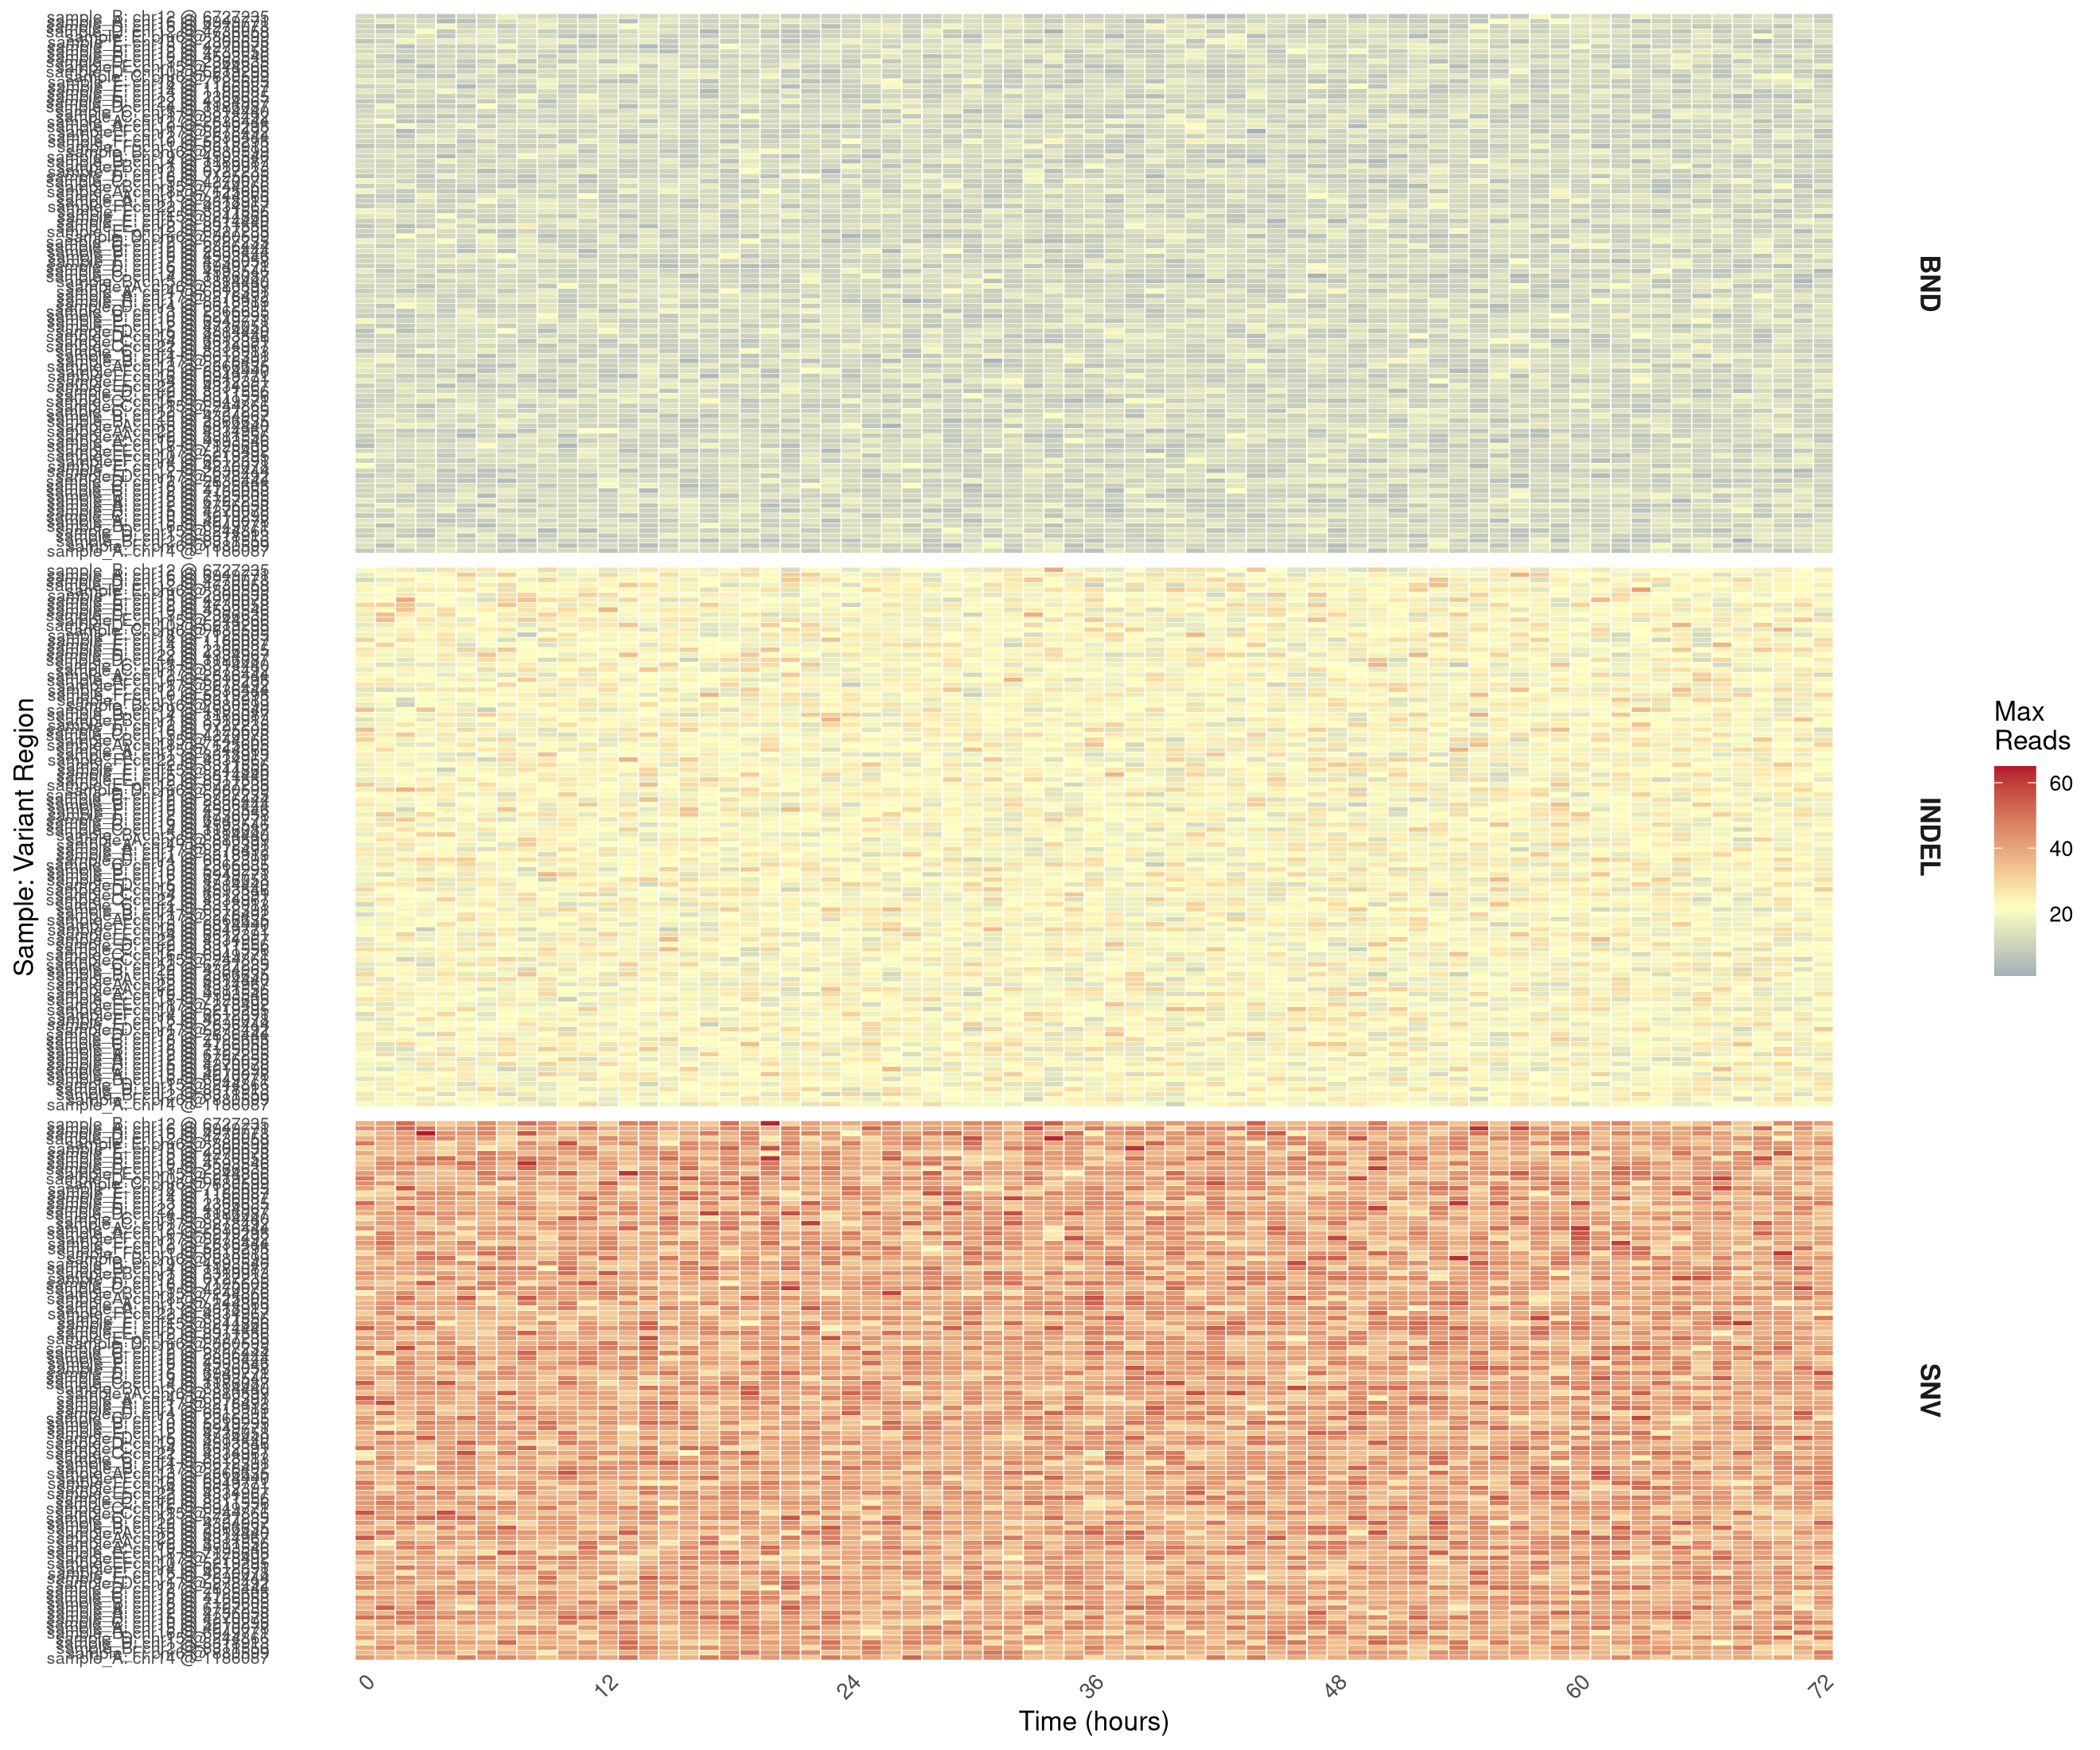
Variant Detection Heatmap
Time-binned variant detection heatmap faceted by variant type.
Mar 6
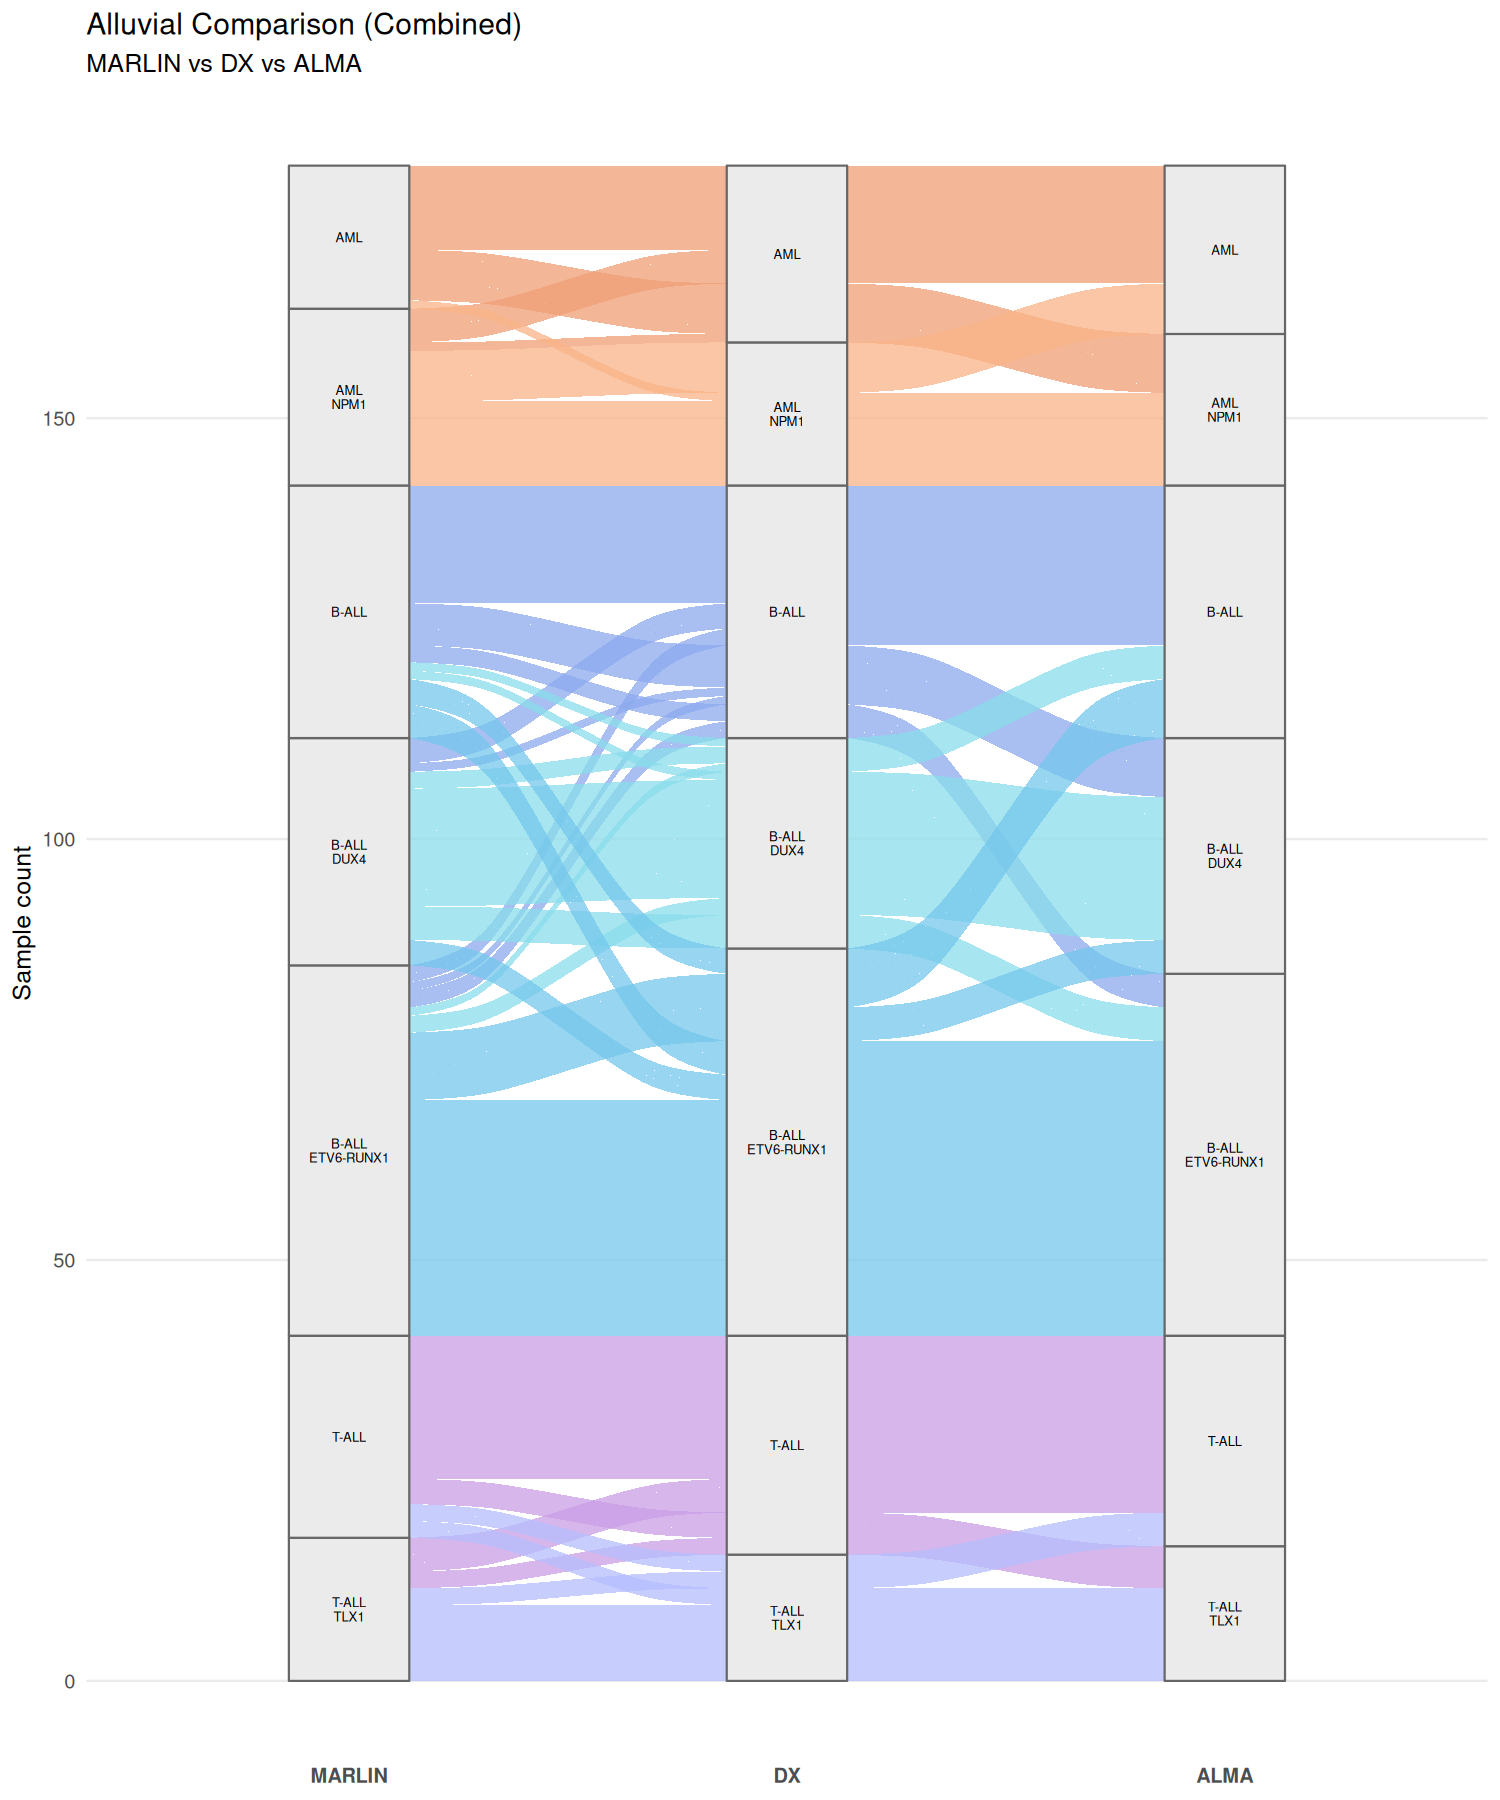
Alluvial Comparison
Main alluvial comparison (MARLIN vs DX vs ALMA) using simple synthetic leukemia test data.
Mar 6
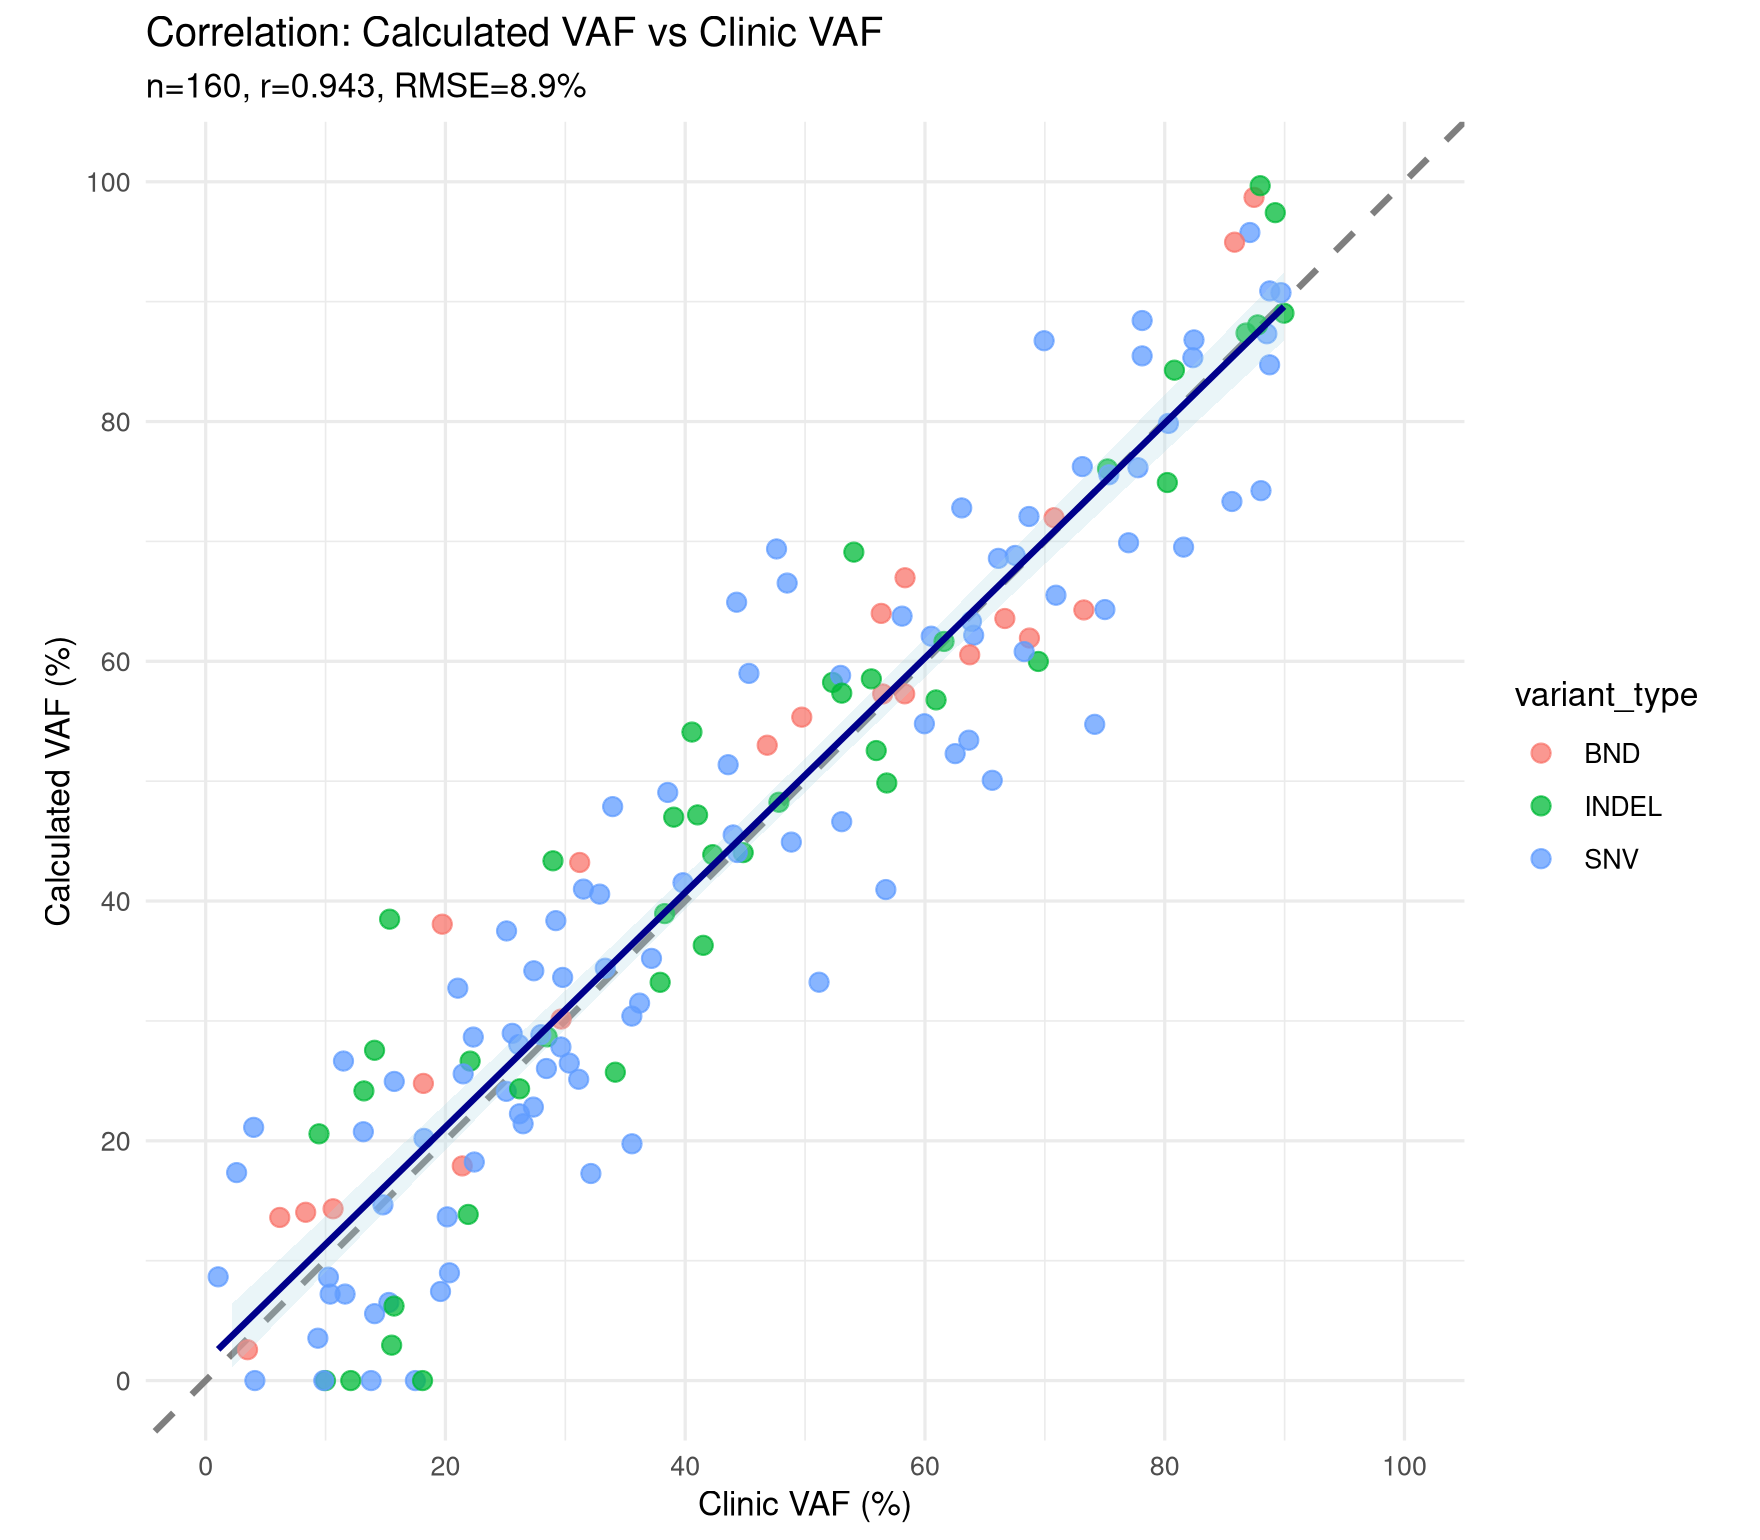
VAF Correlation Scatter
Clinic-vs-calculated VAF correlation plot with regression line and y=x reference.
Mar 5
2023
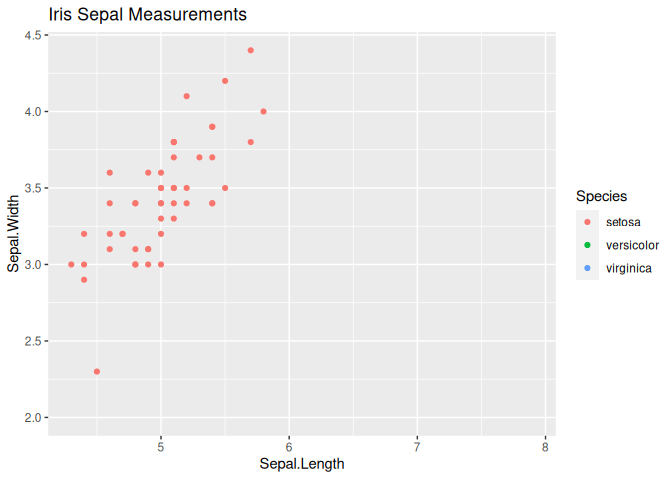
gganimate-example
Animate iris sepal scatter plots by species using ggplot2 and gganimate.
Nov 22
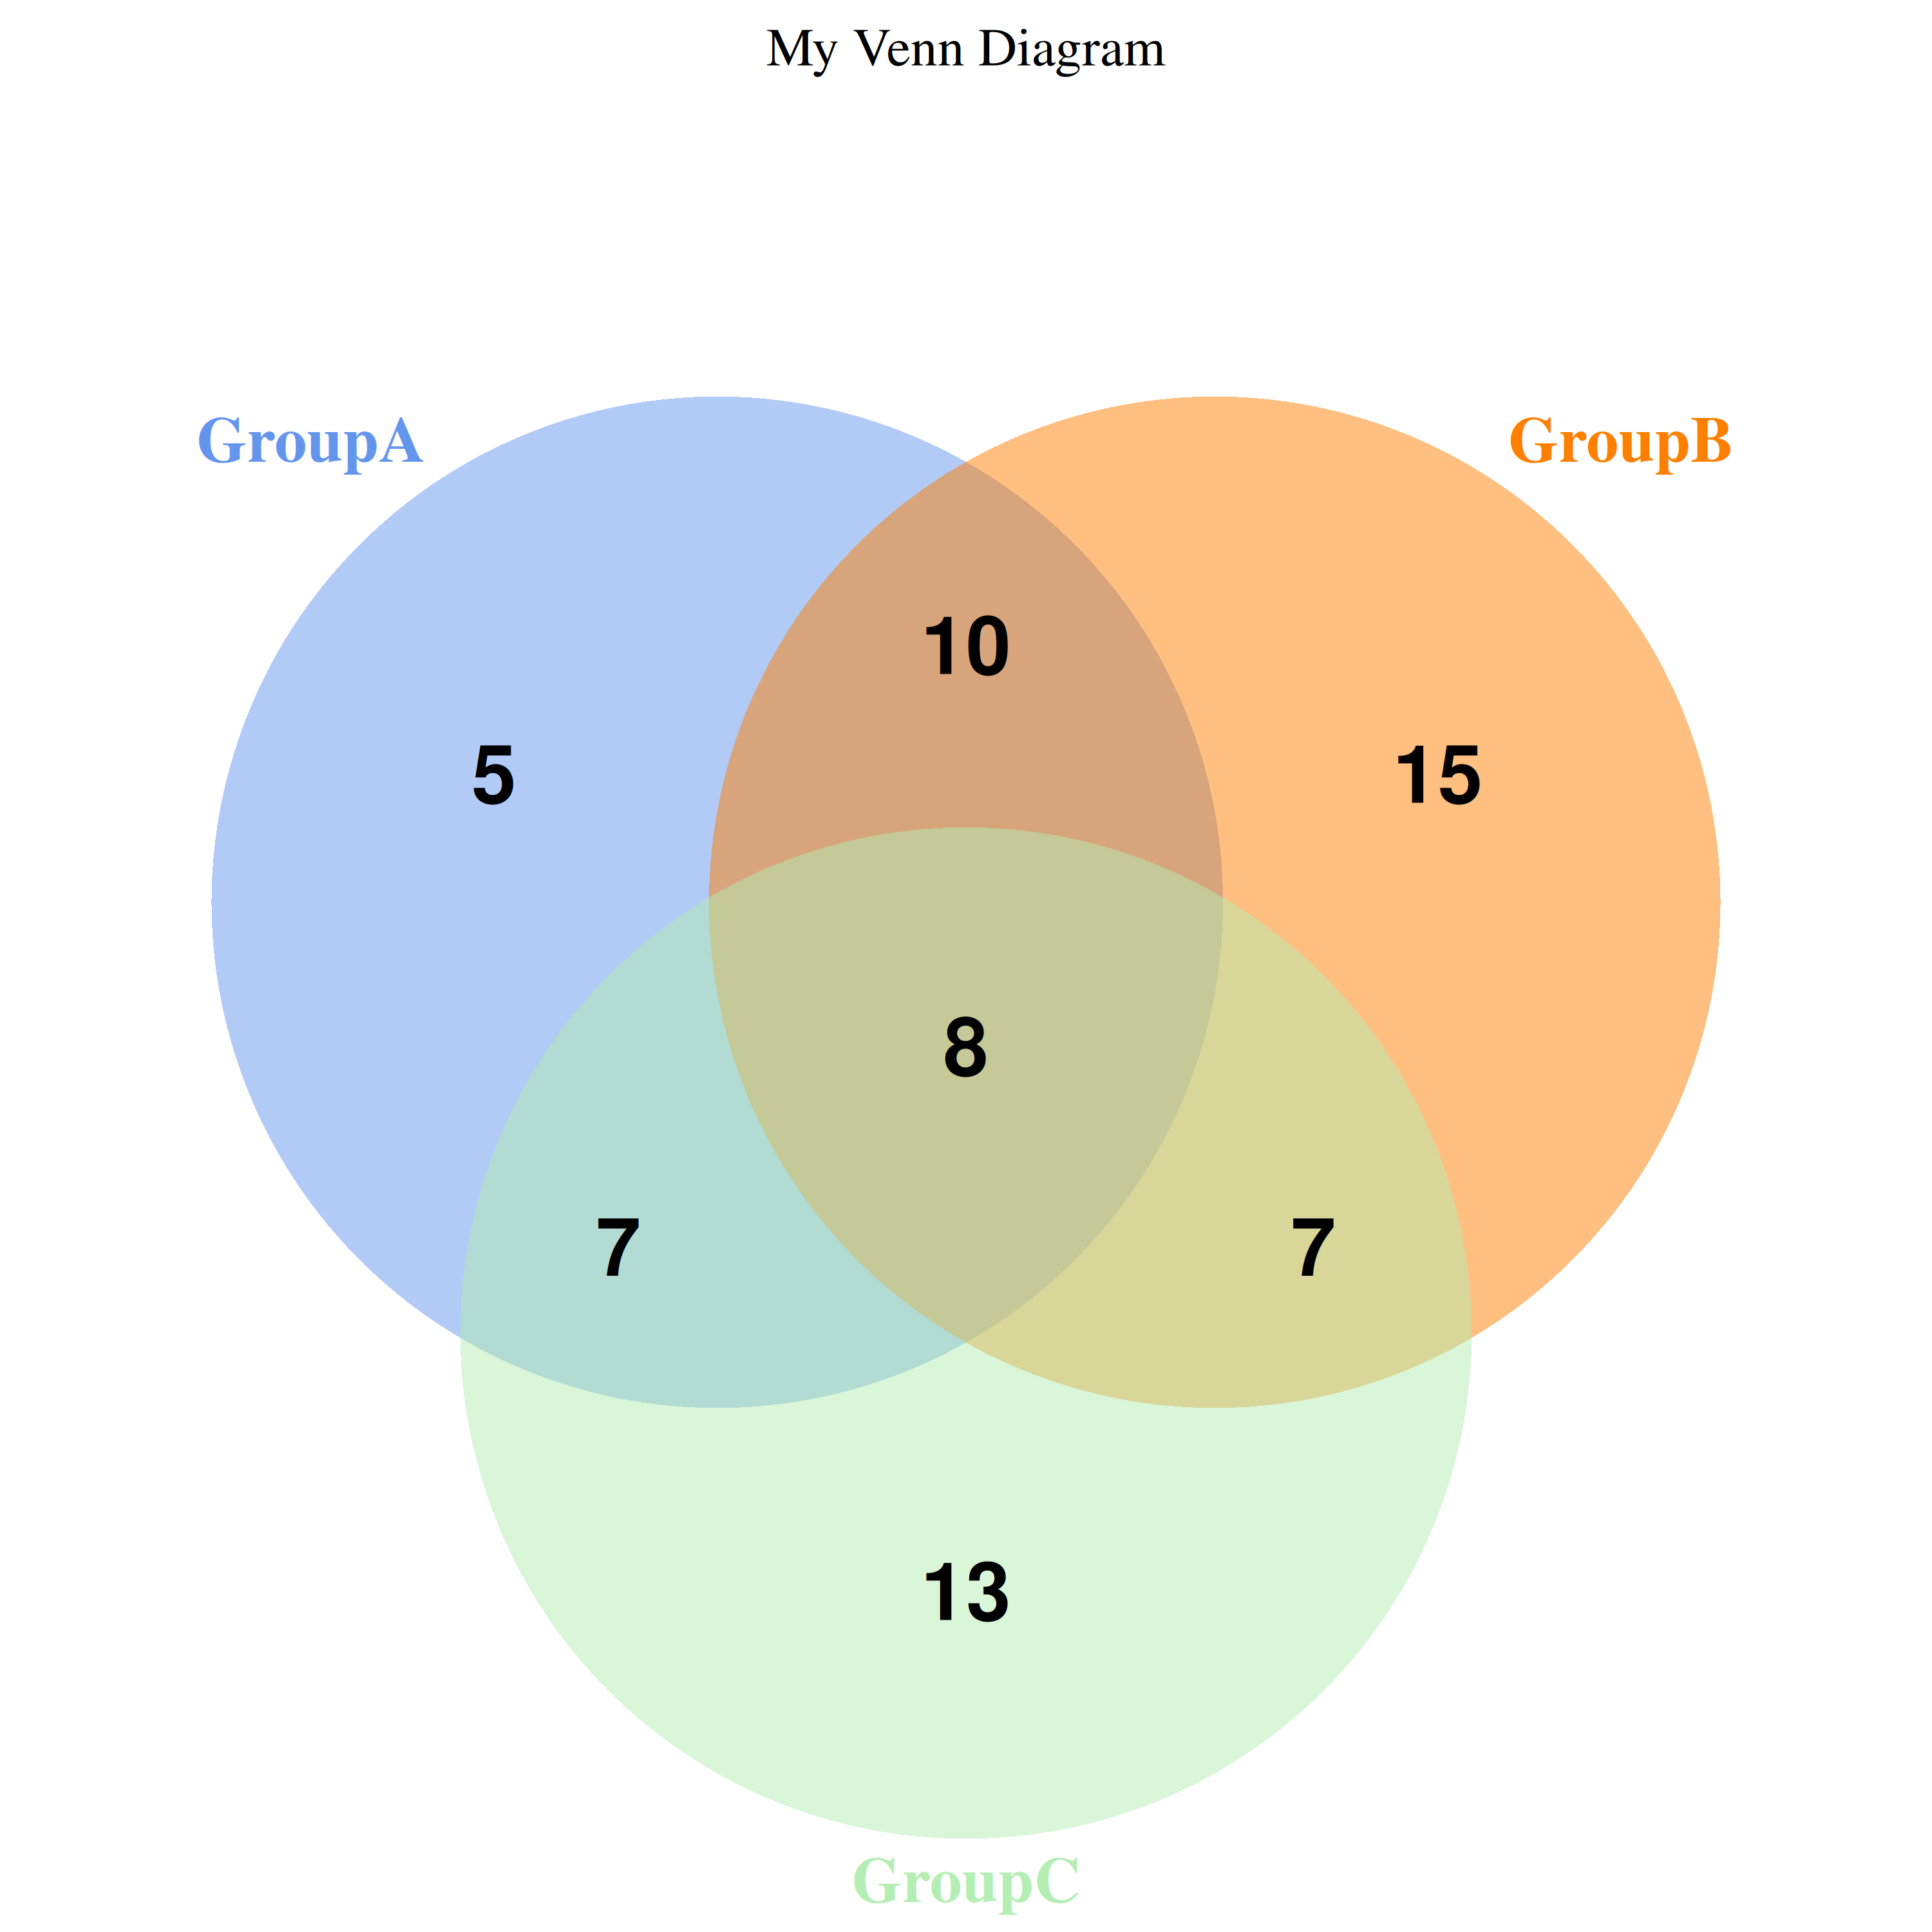
Simple Venn Diagram
Generate a simple three-set Venn diagram in R with the VennDiagram package.
Jul 5