bwbioinfo · GitHub
Last updated:2026-03-13 12:43
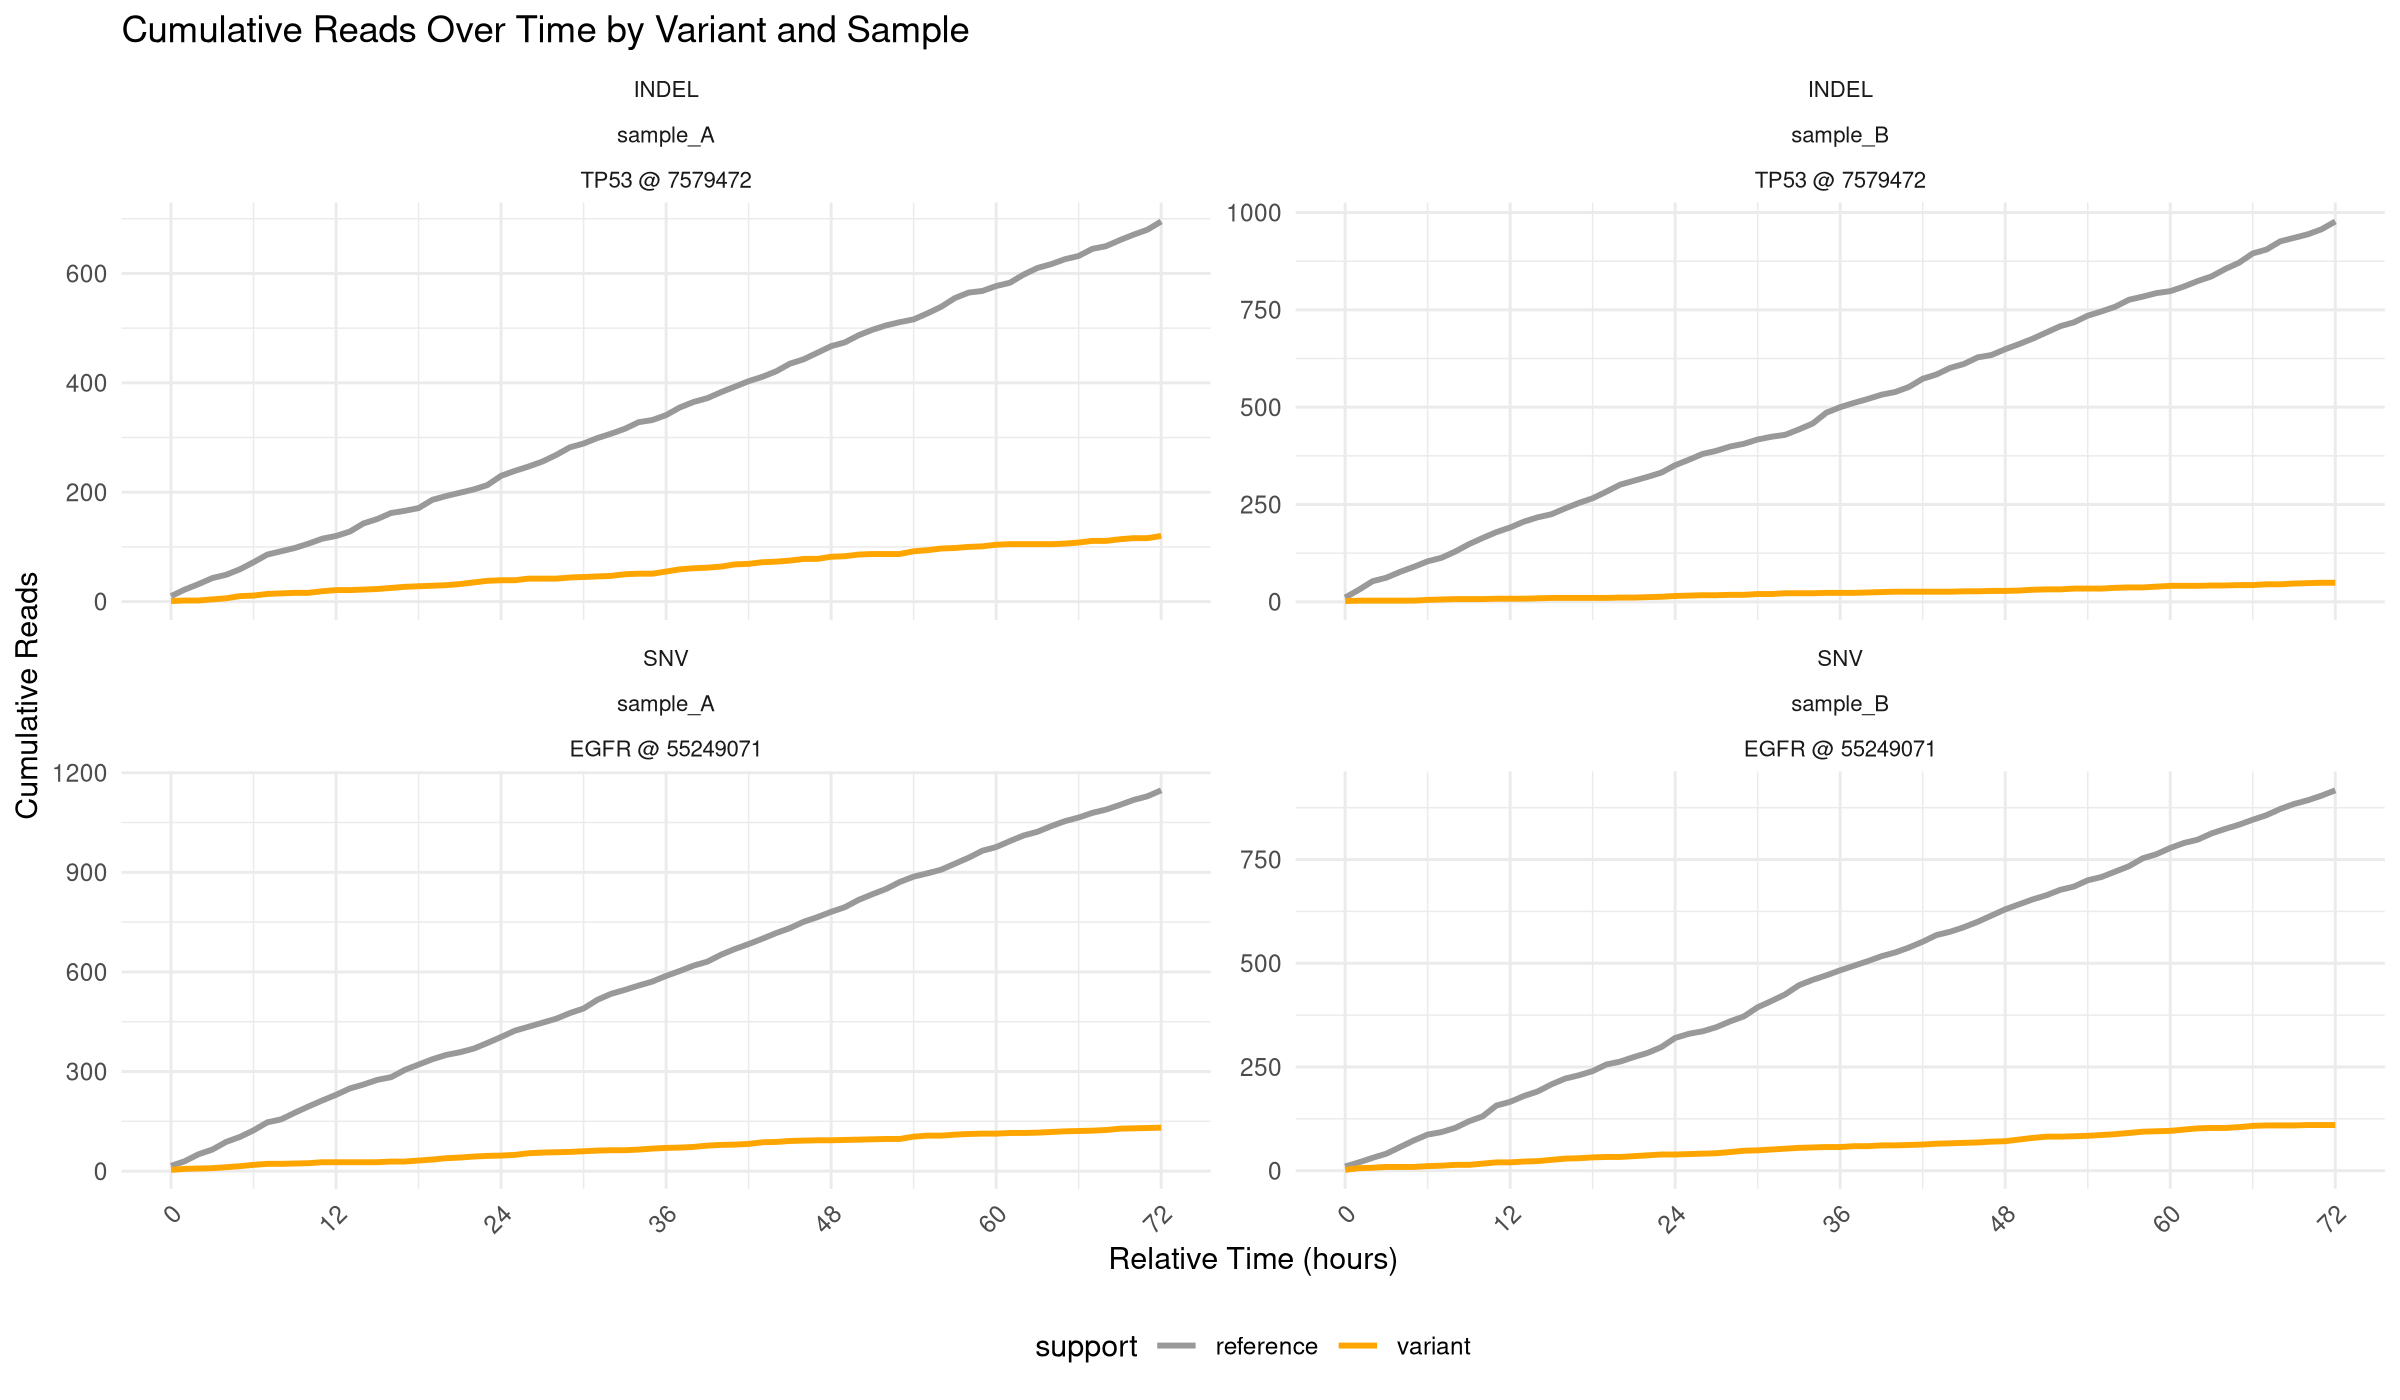
Cumulative Reads Over Time
This script isolates the cumulative read-trajectory panel, matching the 72-hour variant/reference trend view from the full analysis workflow. This code reproduces the base graphic reported in the article Single-workflow Nanopore whole genome sequencing with adaptive sampling for accelerated and comprehensive pediatric cancer profiling.
Data setup
library(dplyr)
library(tidyr)
library(ggplot2)

set.seed(42)

time_hours <- seq(0, 72, by = 1)
samples <- c("sample_A", "sample_B")
variants <- c("EGFR @ 55249071", "TP53 @ 7579472")
support_types <- c("variant", "reference")

agg_cum <- tidyr::crossing(
  sample_name = samples,
  var_region = variants,
  support = support_types,
  rel_time_hours = time_hours
) %>%
  group_by(sample_name, var_region, support) %>%
  mutate(
    rate = ifelse(
      support == "variant",
      runif(1, 0.7, 2.0),
      runif(1, 8, 16)
    ),
    incremental = rpois(n(), lambda = rate),
    cumulative_reads = cumsum(incremental),
    variant_type = ifelse(
      grepl("EGFR", var_region),
      "SNV",
      "INDEL"
    )
  ) %>%
  ungroup()
Isolated plot
p_main <- ggplot(
  agg_cum,
  aes(
    x = rel_time_hours,
    y = cumulative_reads,
    color = support
  )
) +
  geom_line(linewidth = 1) +
  scale_color_manual(
    values = c(
      "variant" = "orange",
      "reference" = "gray60"
    ),
    labels = c(
      "reference" = "Reference Reads",
      "variant" = "Variant Reads"
    )
  ) +
  scale_x_continuous(
    breaks = seq(0, 72, by = 12),
    minor_breaks = seq(0, 72, by = 6)
  ) +
  facet_wrap(
    variant_type ~ sample_name + var_region,
    scales = "free_y",
    drop = TRUE
  ) +
  labs(
    title = paste(
      "Cumulative Reads Over Time",
      "by Variant and Sample"
    ),
    subtitle = paste(
      "Orange lines show variant-supporting reads,",
      "gray lines show reference reads"
    ),
    x = "Relative Time (hours from sequencing start)",
    y = "Cumulative Reads"
  ) +
  theme_minimal() +
  theme(
    legend.position = "bottom",
    strip.text = element_text(size = 8),
    axis.text.x = element_text(angle = 45, hjust = 1)
  )

p_main
Session Info
## R version 4.5.2 (2025-10-31)
## Platform: x86_64-pc-linux-gnu
## Running under: Linux Mint 22.2
##
## Matrix products: default
## BLAS:   /usr/lib/x86_64-linux-gnu/blas/libblas.so.3.12.0
## LAPACK: /usr/lib/x86_64-linux-gnu/lapack/liblapack.so.3.12.0  LAPACK version 3.12.0
##
## locale:
##  [1] LC_CTYPE=en_CA.UTF-8       LC_NUMERIC=C
##  [3] LC_TIME=en_CA.UTF-8        LC_COLLATE=en_CA.UTF-8
##  [5] LC_MONETARY=en_CA.UTF-8    LC_MESSAGES=en_CA.UTF-8
##  [7] LC_PAPER=en_CA.UTF-8       LC_NAME=C
##  [9] LC_ADDRESS=C               LC_TELEPHONE=C
## [11] LC_MEASUREMENT=en_CA.UTF-8 LC_IDENTIFICATION=C
##
## time zone: America/Toronto
## tzcode source: system (glibc)
##
## attached base packages:
## [1] stats     graphics  grDevices utils     datasets  methods   base
##
## loaded via a namespace (and not attached):
##  [1] digest_0.6.39   R6_2.6.1        bookdown_0.46   fastmap_1.2.0
##  [5] xfun_0.56       blogdown_1.23   cachem_1.1.0    knitr_1.51
##  [9] htmltools_0.5.9 rmarkdown_2.30  lifecycle_1.0.5 cli_3.6.5
## [13] sass_0.4.10     jquerylib_0.1.4 compiler_4.5.2  tools_4.5.2
## [17] evaluate_1.0.5  bslib_0.10.0    yaml_2.3.12     otel_0.2.0
## [21] jsonlite_2.0.0  rlang_1.1.7
ggplot2 nanopore cumulative reads variant
392 Words
2026-03-07 19:00 (Last updated: 2026-03-13 12:43)
