bwbioinfo · GitHub
Last updated:2026-03-13 12:43
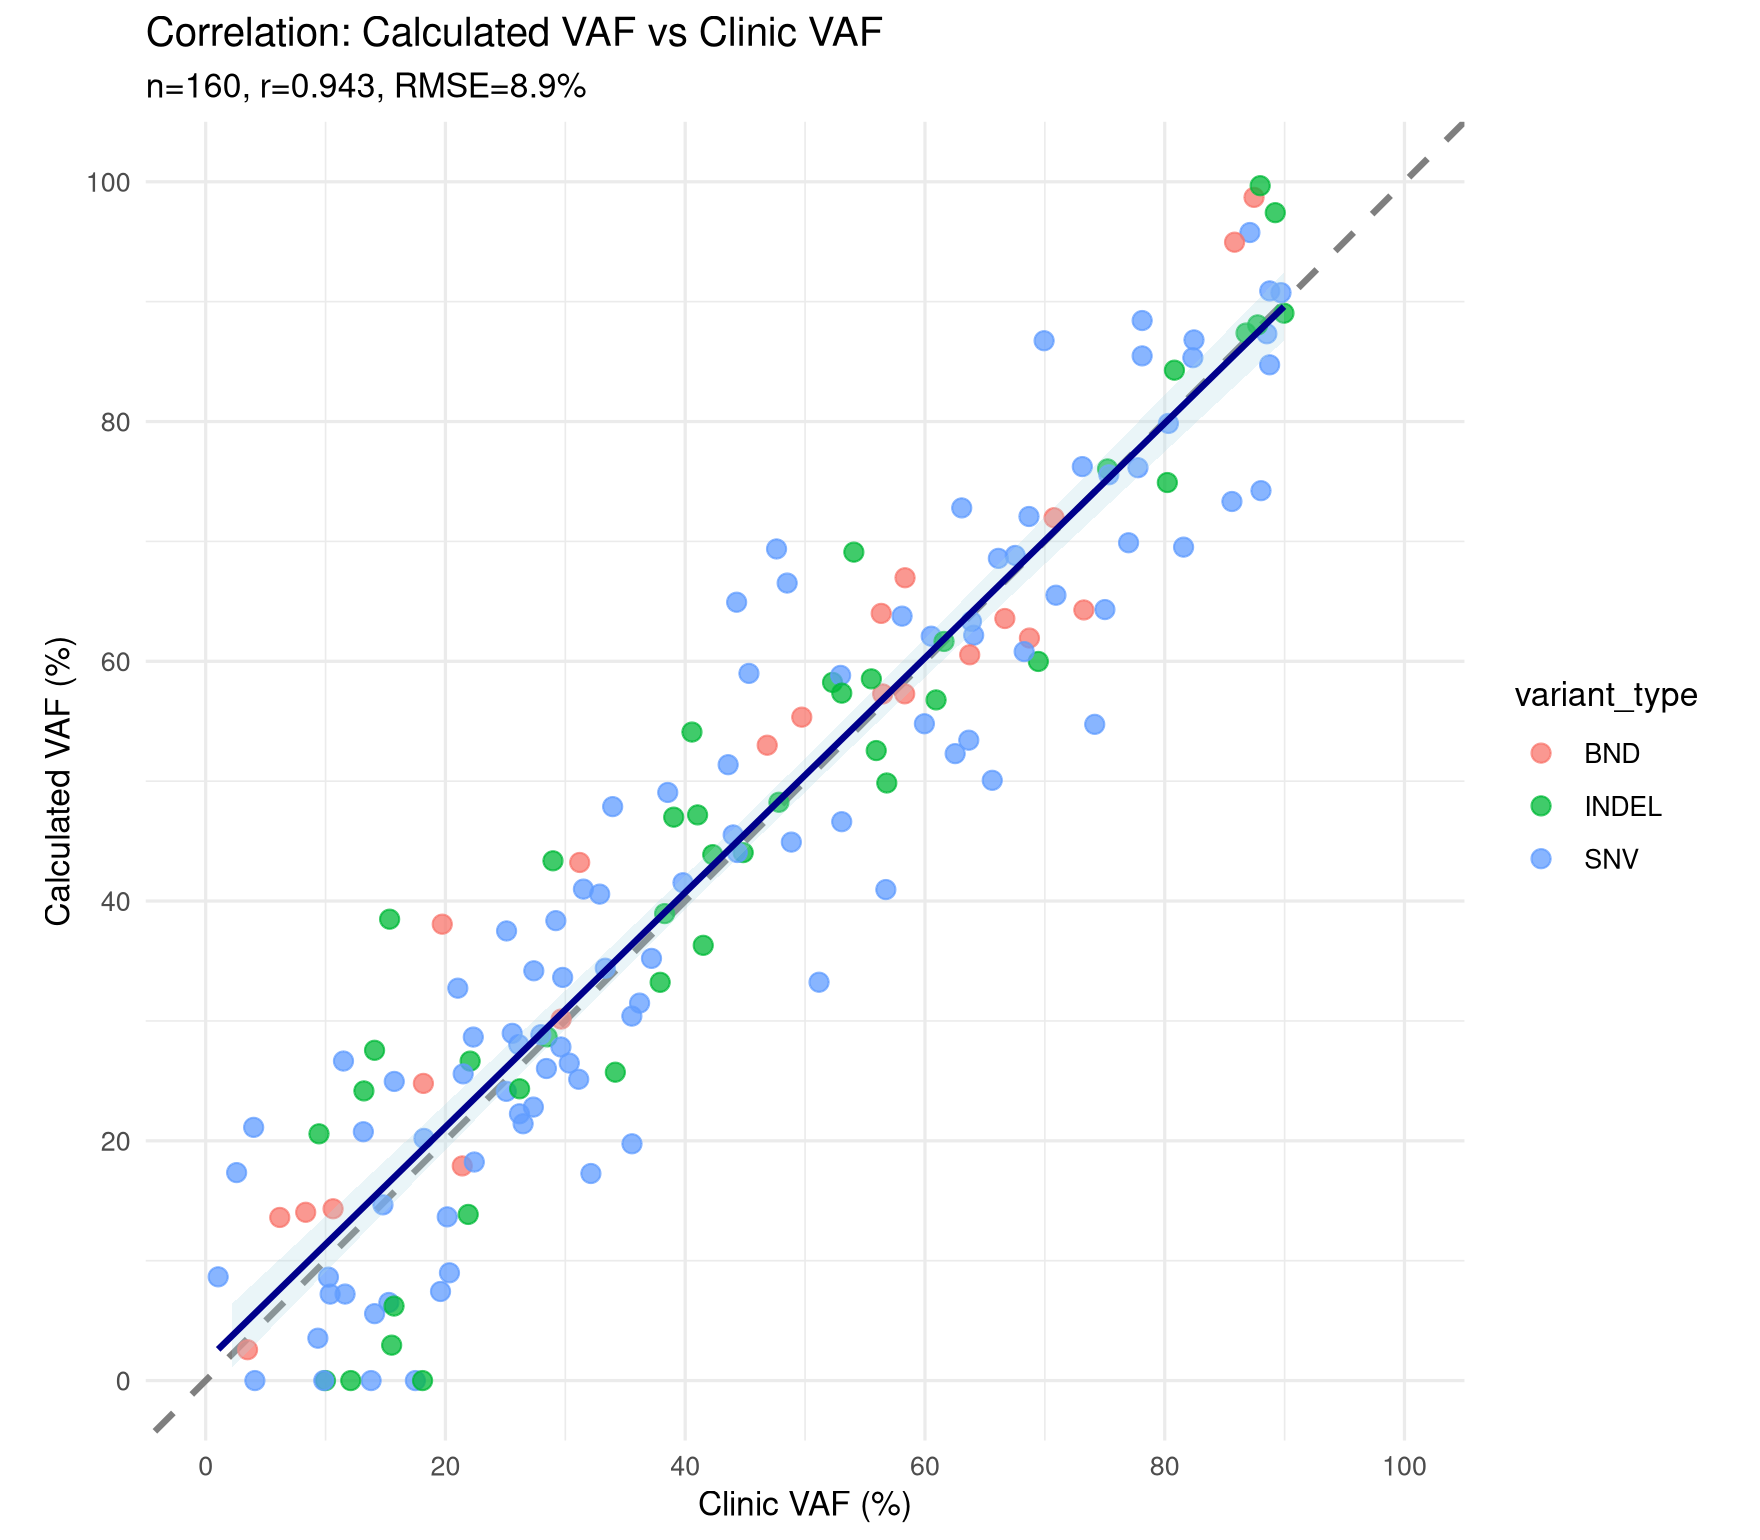
VAF Correlation Scatter
This script isolates the clinic-vs-calculated VAF correlation panel, matching the scatter/regression view from the full analysis workflow. This code reproduces the base graphic reported in the article Single-workflow Nanopore whole genome sequencing with adaptive sampling for accelerated and comprehensive pediatric cancer profiling.
Data setup
library(dplyr)
library(ggplot2)

set.seed(123)

vaf_correlation_data <- tibble::tibble(
  sample_name = sample(
    paste0("sample_", LETTERS[1:8]),
    160,
    replace = TRUE
  ),
  variant_type = sample(
    c("SNV", "INDEL", "BND"),
    160,
    replace = TRUE,
    prob = c(0.6, 0.25, 0.15)
  ),
  clinic_vaf = runif(160, min = 1, max = 90)
) %>%
  mutate(
    vaf = pmin(
      100,
      pmax(0, clinic_vaf + rnorm(n(), mean = 0, sd = 9))
    ),
    vaf_diff = vaf - clinic_vaf
  )

correlation_stats <- vaf_correlation_data %>%
  summarise(
    n = n(),
    correlation = cor(vaf, clinic_vaf),
    rmse = sqrt(mean(vaf_diff^2))
  )
Isolated plot
p_vaf_correlation <- vaf_correlation_data %>%
  ggplot(aes(x = clinic_vaf, y = vaf)) +
  geom_abline(
    intercept = 0,
    slope = 1,
    linetype = "dashed",
    color = "gray50",
    size = 1
  ) +
  geom_point(
    aes(color = variant_type),
    size = 2.6,
    alpha = 0.75
  ) +
  geom_smooth(
    method = "lm",
    se = TRUE,
    color = "darkblue",
    fill = "lightblue",
    alpha = 0.25
  ) +
  scale_x_continuous(
    limits = c(0, 100),
    breaks = seq(0, 100, 20)
  ) +
  scale_y_continuous(
    limits = c(0, 100),
    breaks = seq(0, 100, 20)
  ) +
  coord_fixed() +
  labs(
    title = "Correlation: Calculated VAF vs Clinic VAF",
    subtitle = sprintf(
      "n=%d, r=%.3f, RMSE=%.1f%%",
      correlation_stats$n,
      correlation_stats$correlation,
      correlation_stats$rmse
    ),
    x = "Clinic VAF (%)",
    y = "Calculated VAF (%)"
  ) +
  theme_minimal()

p_vaf_correlation
Session Info
## R version 4.5.2 (2025-10-31)
## Platform: x86_64-pc-linux-gnu
## Running under: Linux Mint 22.2
##
## Matrix products: default
## BLAS:   /usr/lib/x86_64-linux-gnu/blas/libblas.so.3.12.0
## LAPACK: /usr/lib/x86_64-linux-gnu/lapack/liblapack.so.3.12.0  LAPACK version 3.12.0
##
## locale:
##  [1] LC_CTYPE=en_CA.UTF-8       LC_NUMERIC=C
##  [3] LC_TIME=en_CA.UTF-8        LC_COLLATE=en_CA.UTF-8
##  [5] LC_MONETARY=en_CA.UTF-8    LC_MESSAGES=en_CA.UTF-8
##  [7] LC_PAPER=en_CA.UTF-8       LC_NAME=C
##  [9] LC_ADDRESS=C               LC_TELEPHONE=C
## [11] LC_MEASUREMENT=en_CA.UTF-8 LC_IDENTIFICATION=C
##
## time zone: America/Toronto
## tzcode source: system (glibc)
##
## attached base packages:
## [1] stats     graphics  grDevices utils     datasets  methods   base
##
## loaded via a namespace (and not attached):
##  [1] digest_0.6.39   R6_2.6.1        bookdown_0.46   fastmap_1.2.0
##  [5] xfun_0.56       blogdown_1.23   cachem_1.1.0    knitr_1.51
##  [9] htmltools_0.5.9 rmarkdown_2.30  lifecycle_1.0.5 cli_3.6.5
## [13] sass_0.4.10     jquerylib_0.1.4 compiler_4.5.2  tools_4.5.2
## [17] evaluate_1.0.5  bslib_0.10.0    yaml_2.3.12     otel_0.2.0
## [21] jsonlite_2.0.0  rlang_1.1.7
