bwbioinfo · GitHub
Last updated:2026-03-13 12:43
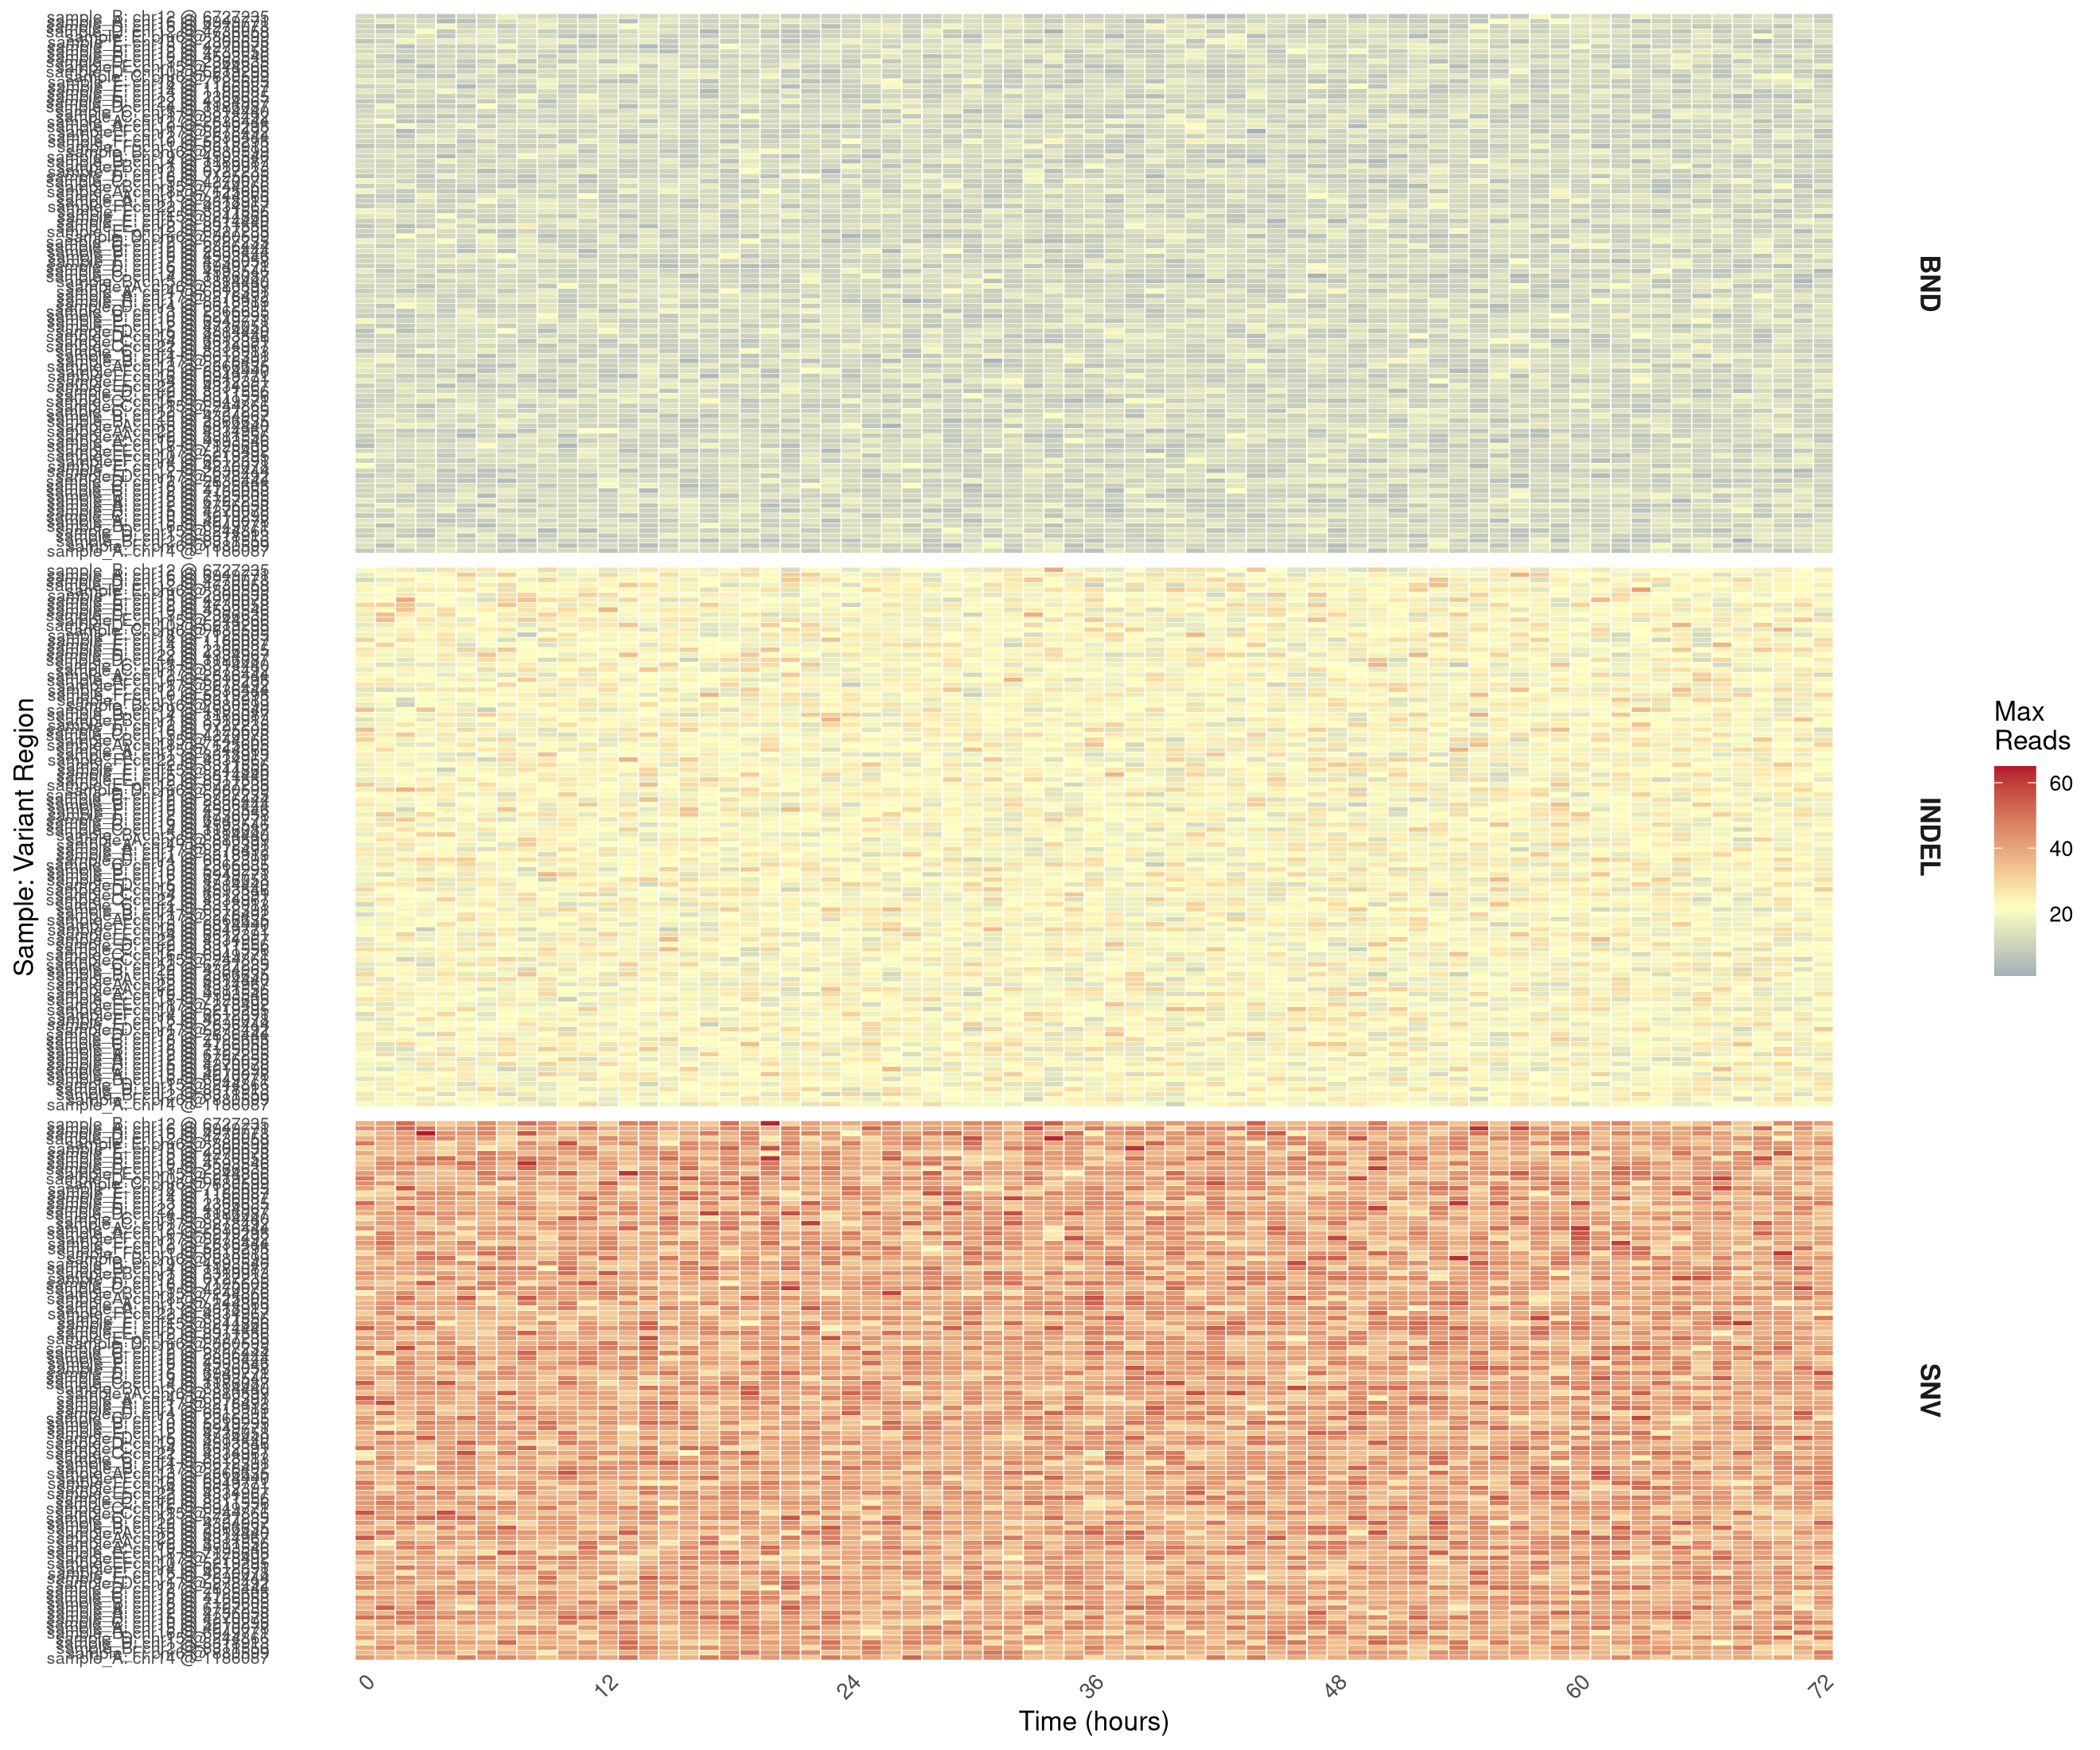
Variant Detection Heatmap
This script isolates the variant-detection heatmap panel, matching the time-binned detection view from the full analysis workflow. This code reproduces the base graphic reported in the article Single-workflow Nanopore whole genome sequencing with adaptive sampling for accelerated and comprehensive pediatric cancer profiling.
Data setup
library(dplyr)
library(tidyr)
library(stringr)
library(ggplot2)

set.seed(2026)

heatmap_data <- tidyr::crossing(
  sample_name = paste0("sample_", LETTERS[1:6]),
  var_region = paste0(
    "chr",
    sample(c(1:22, "X"), 18, replace = TRUE),
    " @ ",
    sample(1e5:9e6, 18)
  ),
  time_bin_hours = 0:72,
  variant_type = c("SNV", "INDEL", "BND")
) %>%
  mutate(
    max_reads = rpois(n(), lambda = case_when(
      variant_type == "SNV" ~ 40,
      variant_type == "INDEL" ~ 22,
      TRUE ~ 12
    ))
  ) %>%
  filter(max_reads > 0) %>%
  group_by(sample_name, var_region, variant_type) %>%
  mutate(overall_max = max(max_reads)) %>%
  ungroup() %>%
  mutate(
    var_region_clean = str_trunc(var_region, 28),
    variant_sample_label = paste0(
      sample_name,
      ": ",
      var_region_clean
    )
  )
Isolated plot
p_heatmap <- heatmap_data %>%
  ggplot(
    aes(
      x = time_bin_hours,
      y = reorder(variant_sample_label, overall_max),
      fill = max_reads
    )
  ) +
  geom_tile(
    color = "white",
    size = 0.08,
    height = 1,
    width = 0.95
  ) +
  scale_fill_gradient2(
    low = "#2166AC",
    mid = "#FFFFBF",
    high = "#B2182B",
    midpoint = median(heatmap_data$max_reads),
    name = "Max\nReads"
  ) +
  scale_x_continuous(
    breaks = seq(0, 72, by = 12),
    minor_breaks = seq(0, 72, by = 6)
  ) +
  facet_grid(
    variant_type ~ .,
    scales = "free_y",
    space = "free_y"
  ) +
  labs(x = "Time (hours)", y = "Sample: Variant Region") +
  theme_minimal() +
  theme(
    axis.text.x = element_text(
      angle = 45,
      hjust = 1,
      size = 9
    ),
    axis.text.y = element_text(size = 7),
    strip.text = element_text(size = 11, face = "bold"),
    panel.grid = element_blank()
  )

p_heatmap
Session Info
## R version 4.5.2 (2025-10-31)
## Platform: x86_64-pc-linux-gnu
## Running under: Linux Mint 22.2
##
## Matrix products: default
## BLAS:   /usr/lib/x86_64-linux-gnu/blas/libblas.so.3.12.0
## LAPACK: /usr/lib/x86_64-linux-gnu/lapack/liblapack.so.3.12.0  LAPACK version 3.12.0
##
## locale:
##  [1] LC_CTYPE=en_CA.UTF-8       LC_NUMERIC=C
##  [3] LC_TIME=en_CA.UTF-8        LC_COLLATE=en_CA.UTF-8
##  [5] LC_MONETARY=en_CA.UTF-8    LC_MESSAGES=en_CA.UTF-8
##  [7] LC_PAPER=en_CA.UTF-8       LC_NAME=C
##  [9] LC_ADDRESS=C               LC_TELEPHONE=C
## [11] LC_MEASUREMENT=en_CA.UTF-8 LC_IDENTIFICATION=C
##
## time zone: America/Toronto
## tzcode source: system (glibc)
##
## attached base packages:
## [1] stats     graphics  grDevices utils     datasets  methods   base
##
## loaded via a namespace (and not attached):
##  [1] digest_0.6.39   R6_2.6.1        bookdown_0.46   fastmap_1.2.0
##  [5] xfun_0.56       blogdown_1.23   cachem_1.1.0    knitr_1.51
##  [9] htmltools_0.5.9 rmarkdown_2.30  lifecycle_1.0.5 cli_3.6.5
## [13] sass_0.4.10     jquerylib_0.1.4 compiler_4.5.2  tools_4.5.2
## [17] evaluate_1.0.5  bslib_0.10.0    yaml_2.3.12     otel_0.2.0
## [21] jsonlite_2.0.0  rlang_1.1.7
